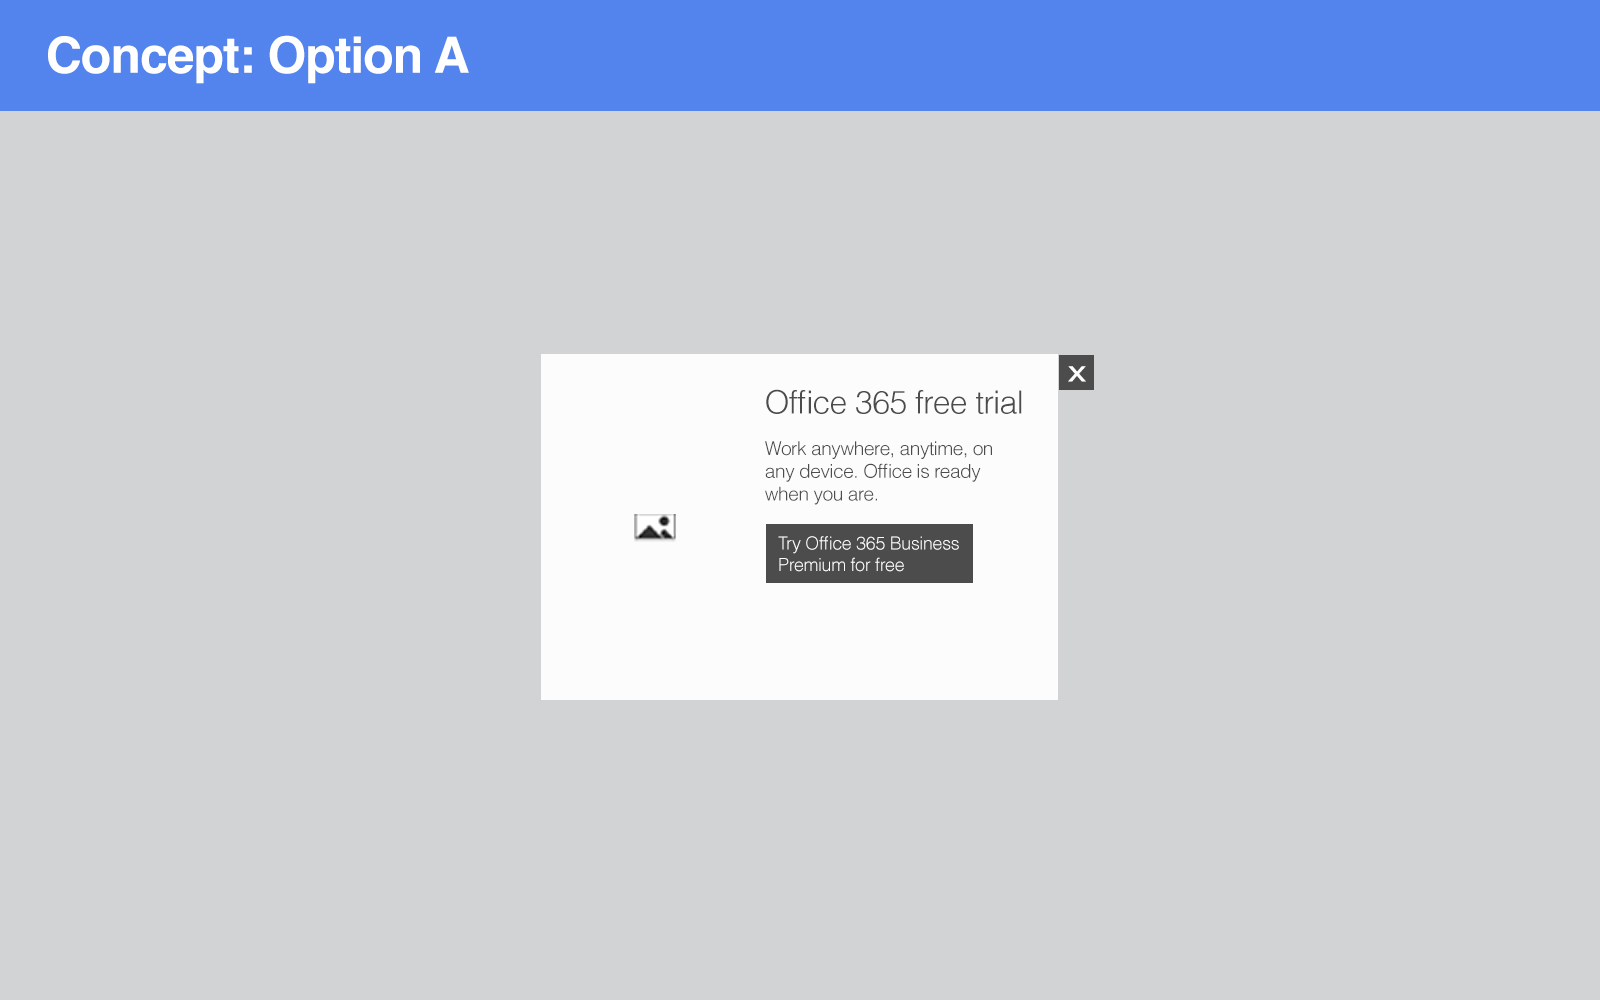
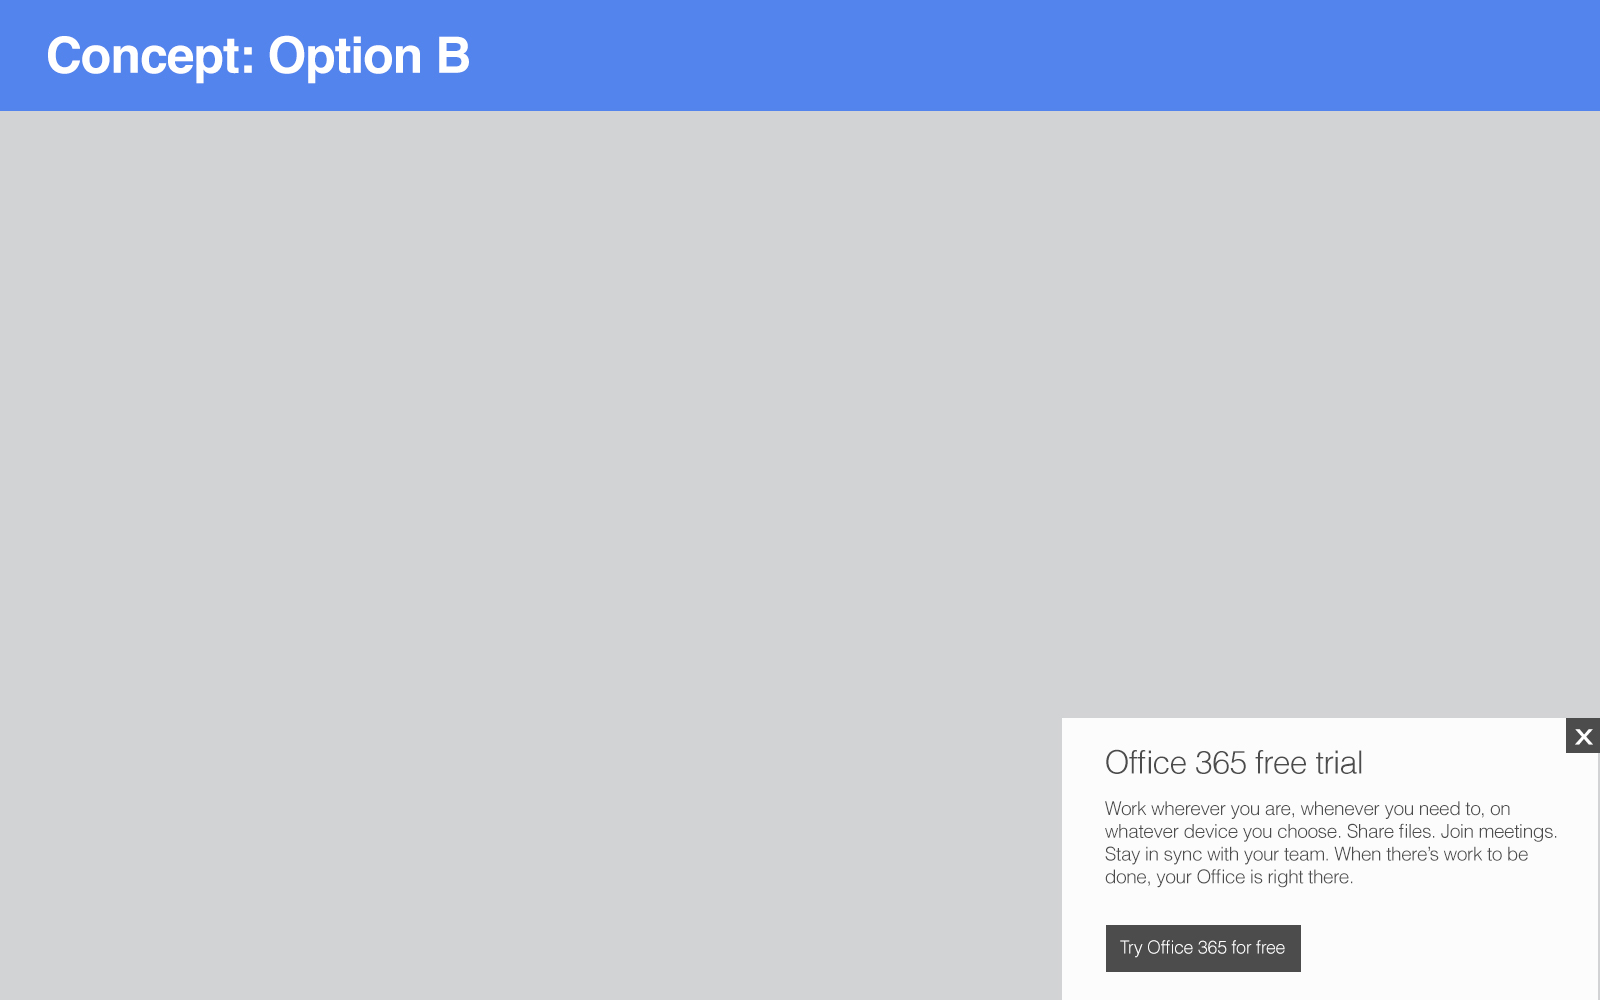
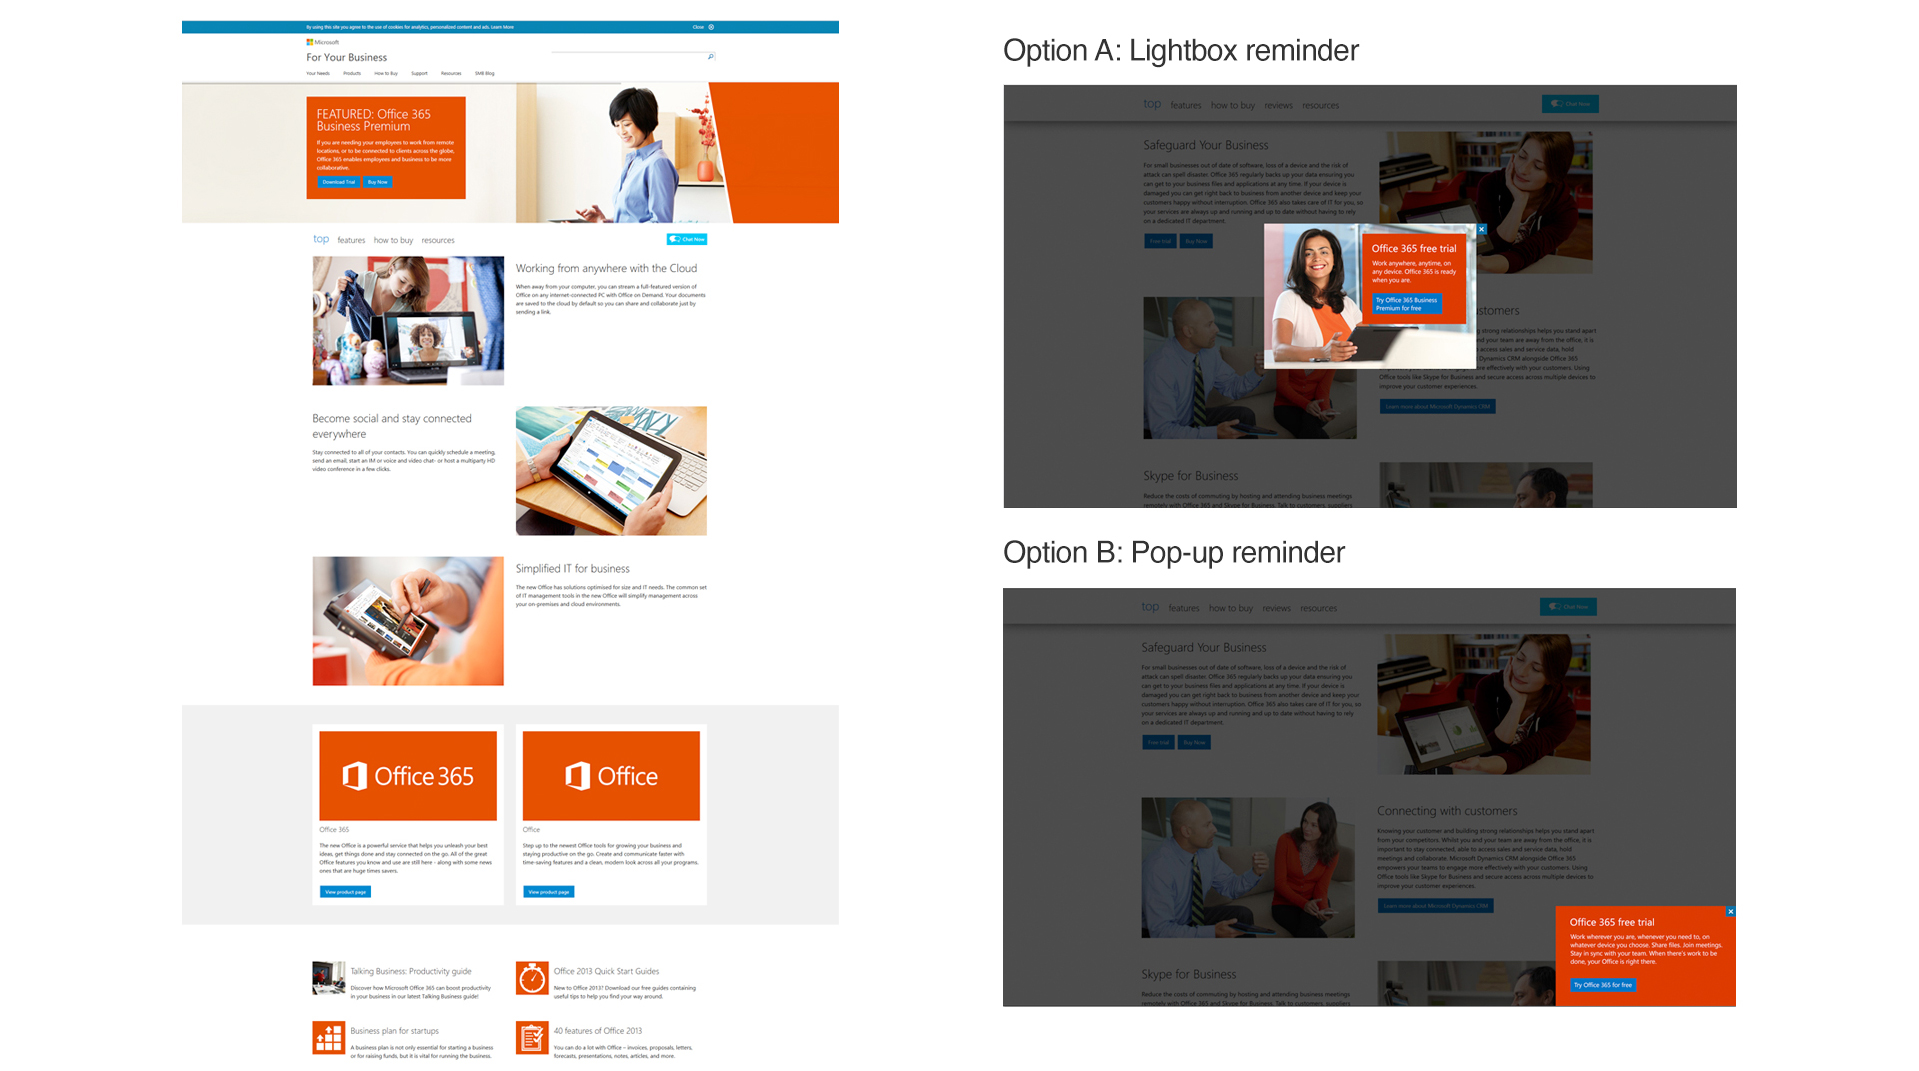
As a member of the Design Team at Microsoft, I was tasked with improving the membership sign-up rate for Microsoft Office 365 products. The existing website design and content were not effectively driving conversions, and the team wanted to identify ways to increase sign-ups among corporate users.
Process
- 1. Initial Assessment and Goal Setting
- I began by collaborating with the marketing and product teams to understand the current conversion rates, user demographics, and pain points.
- The primary goal was to increase membership sign-ups for Microsoft Office 365 products by optimising the website design and content.
- 2. Hypothesis Formulation
- I formulated a hypothesis that a redesigned website with clearer messaging, improved visual hierarchy, and compelling CTAs would lead to higher membership sign-ups.
- To validate this hypothesis, I proposed conducting an A/B test, where we would compare the current website (A) with a redesigned version (B).
- 3. Designing Variations
- I worked closely with business stakeholders to create the redesigned version (B) of the website. This version included:
- Clearer value proposition: Highlighting the benefits of Office 365 for corporate users.
- Improved visual hierarchy: Making key information and CTAs more prominent.
- Streamlined sign-up process: Simplifying the steps needed to become a member.
- 4. Setting Up the A/B Test
- I collaborated with the development team to set up the A/B testing infrastructure.
- We ensured that visitors to the website were randomly assigned to either the control group (A) or the variation group (B).
- 5. Data Collection and Analysis
- Over a period of two weeks, we collected data on user interactions, click-through rates, and conversion rates for both versions of the website.
- I used statistical analysis to determine if the variation (B) showed a statistically significant improvement in sign-up rates compared to the control (A).
- 6. Results and Insights
- The analysis revealed that the redesigned version (B) of the website led to a 17% increase in membership sign-ups compared to the original version (A).
- This indicated that the hypothesis was correct, and the changes made in the redesign positively impacted user engagement and conversions.
- 7. Implementation and Iteration
- With the positive results, the redesigned website (B) was implemented as the new default version.
- Regular monitoring and analytics tracking were put in place to ensure continued success and identify areas for further optimisation.
- 8. Continuous Improvement
- Based on ongoing data analysis and user feedback, the corporate design team continued to make iterative improvements to the website design and content to further enhance conversion rates.


High-Fidelity

Outcome
Through the A/B testing process, I successfully identified design and content changes that significantly improved membership sign-ups for Microsoft Office 365 products with a light box feature. This approach demonstrated the effectiveness of data-driven decision-making and collaboration within a corporate design team to achieve tangible business goals.
